Nightlight during conflict
In 2019 PNGK worked with UNHabitat to develope Urban Indicators for 8 cities in Yemen. The main goal of this project was to create a user friendly interface to provide insight on the stress on urban environments in Yemen. This allows donors, governments and organizations to make more informed decisions.
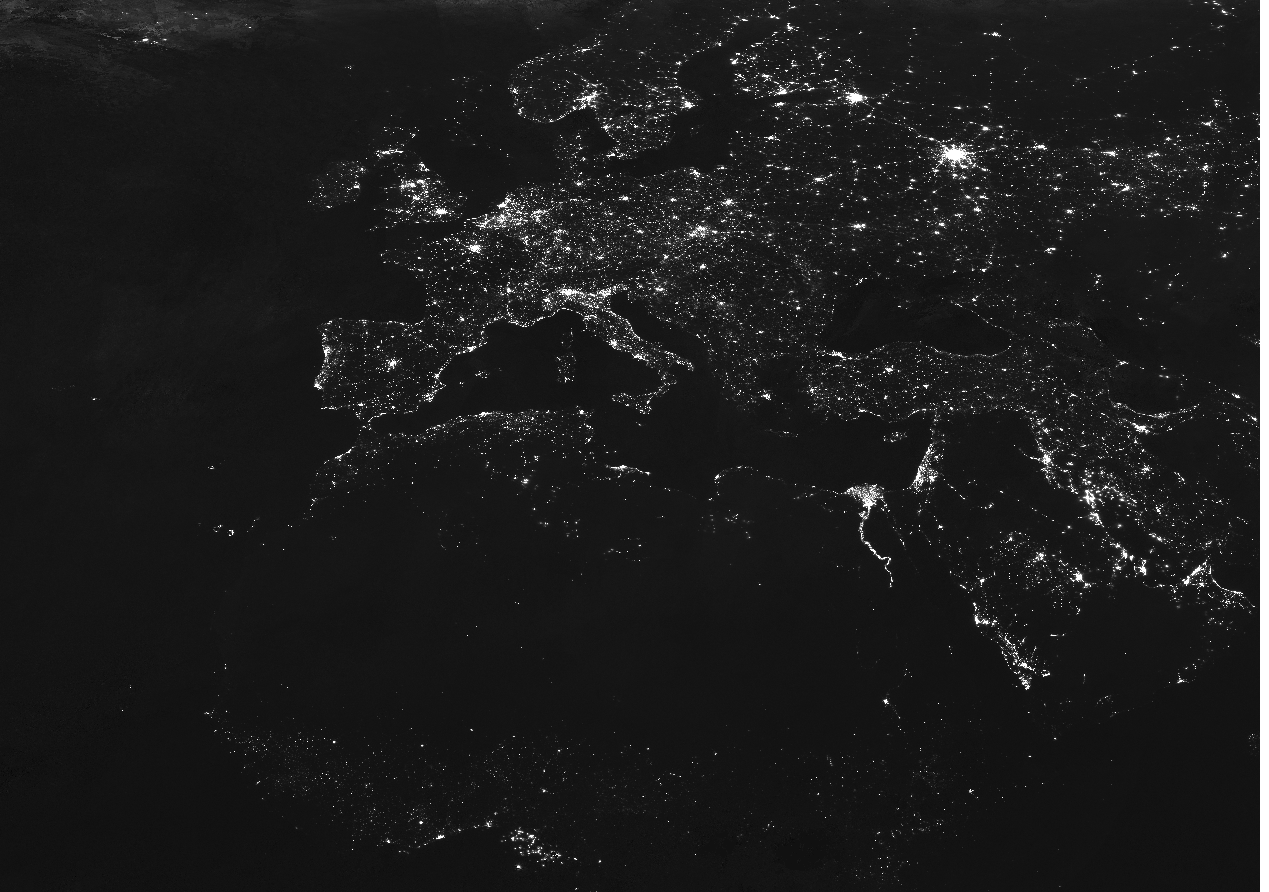 Figure 1: Raw nightlight data, from February 2018 - exported as a png file - provided by NCEI.
Nightlight was one of the indicators we utilized in this project. During the course of the project, PNGK found that open-source data was readily available and decided to explore the issue further and expand this indicator into a fully fledged interactive tool.
What is a nightlight indicator?
Human settlements emit light during night hours. These lights can be captured by sensors on satellites. Cities, for example, provide a clearly measurable amount of light which can be easily compared over different time periods.
These measurements can give you an indication of changes in the environment of a city, including more or less usage of light, surges in light during certain periods or special events and patterns of behavior in the life of a city.
Why nightlight indicators?
The reality is that while nightlight as an indicator is beginning to be used in the fields of humanitarian relief, development and urban renewal, there are not many specific use cases for this type of data. PNGK is developing and disseminating this tool to allow users in different fields to consider this technology for use in their own work.
An example of how nightlight data may be relevant can be seen in several studies which suggest a strong correlation between night light output and GDP. See Henderson et. al for more information.
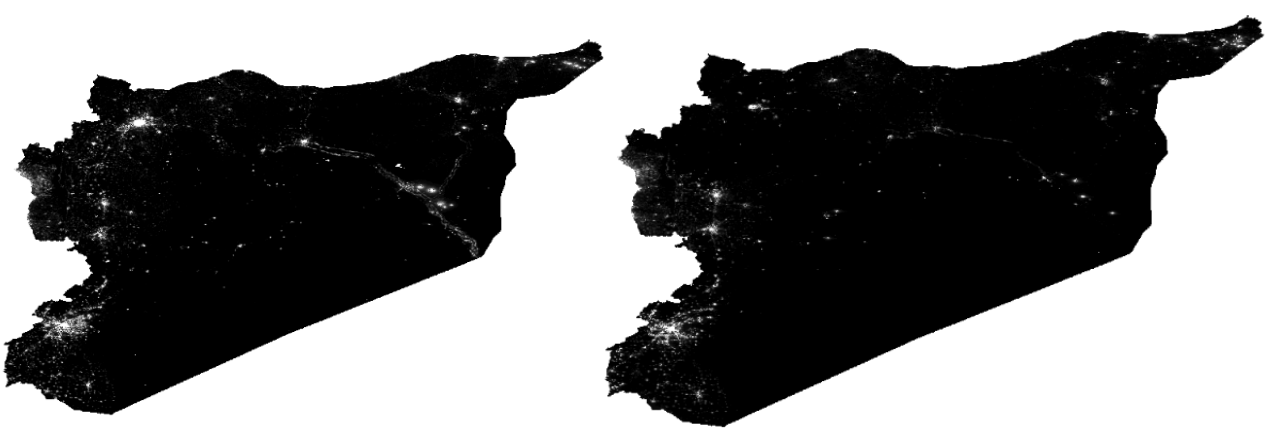 Figure 2: Syria July 2012 (left) and Syria July 2019 (right)
The figure above shows a map of nightlight in Syria in July 2012 and July 2019. Notice, for example, how much brighter Aleppo (the light produced in the top left of the map) is in 2012 prior to being significantly impacted by the conflict in Syria. Traffic travelling from Iraq on a major through eastern Syria is also gone in the July 2019 map.
How were the nightlight indicators created?
The Earth Observation Group, NOAA National Centers for Environmental Information (NCEI) provides monthly observations at a resolution of 15 arc-seconds, or roughly 450 by 450 meters. We took these observations and represented them in two distant manners.
Spacial representation
We took each pixel value and represented it as a vector perpendicular to the earth’s surface. This vector is plotted on a log scale.
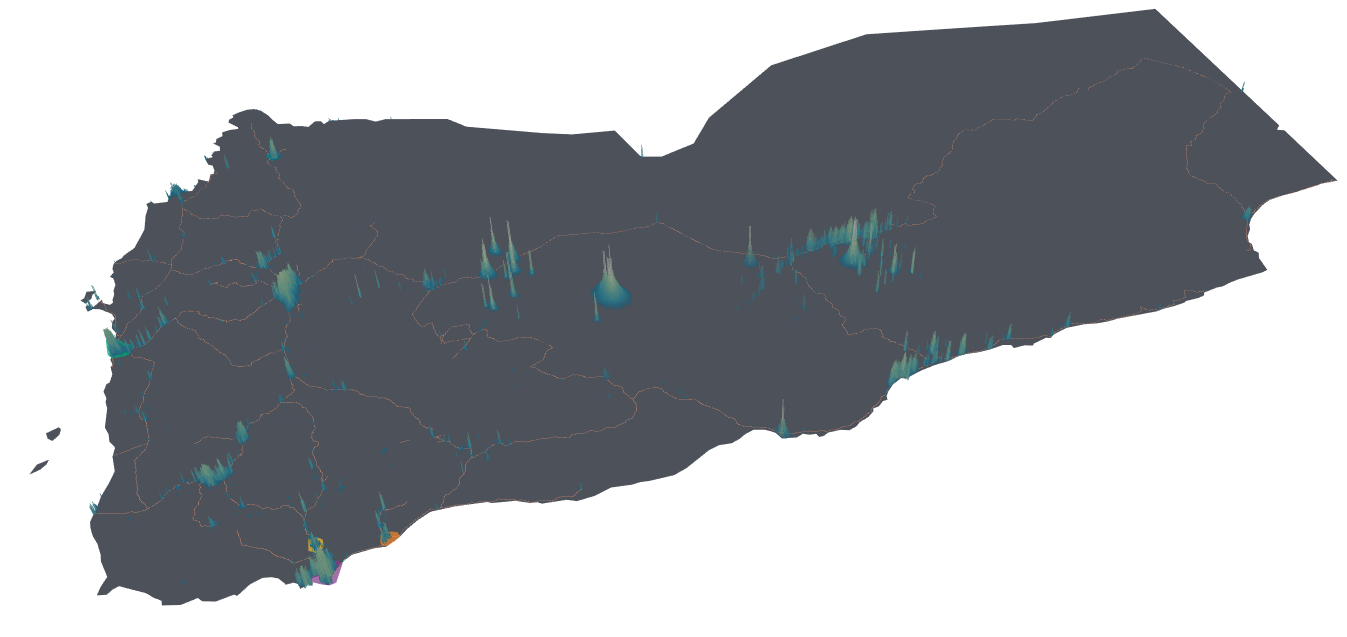 Figure 3: Yemen December 2012 where nightlight values are represented as vectors
Total city brightness
By summing each pixle value which falls in the boundary of the city we have the total light a city emits at a point in time.
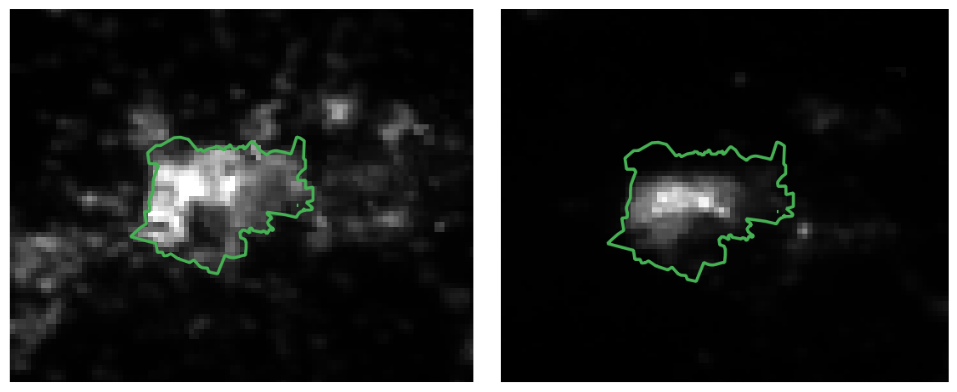 Figure 4: The boundaries of Aleppo in August 2012 (left) and August 2019 (right)
We display this data as a line chart with a single observation each month. Figure 5 shows these monthly observations for Sa’ana, Yemen. We found it interesting that the yearly peaks in brightness correspond with Ramadan.
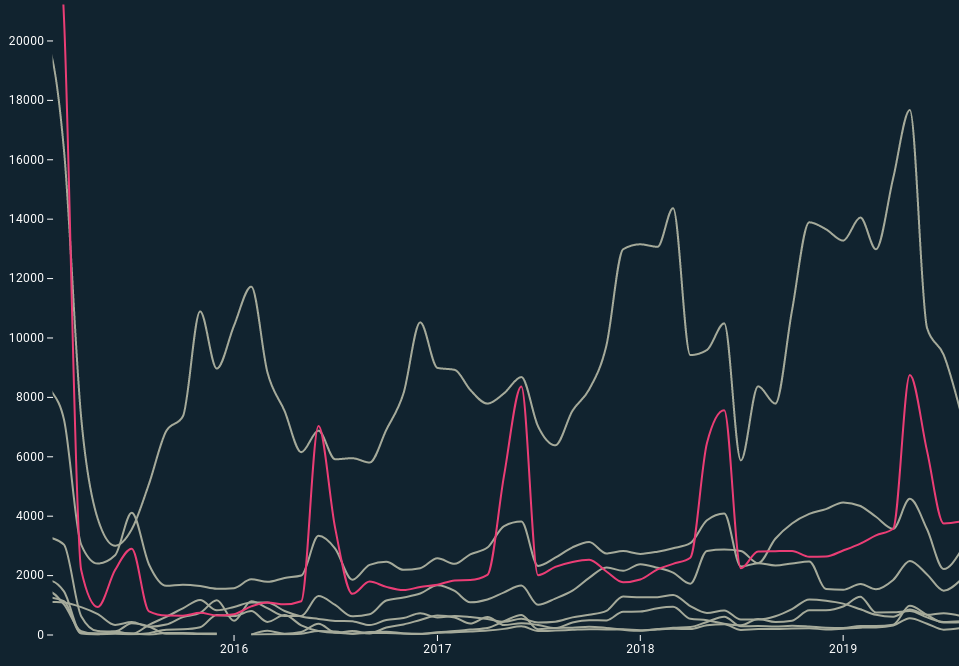 Figure 5: Monthly observation line chart highlighting Sa'ana
If you think this project is of interest or would like to discuss how this tool can be used in your field please contact PNGK!